Bitcoin price rebounds above $79,000
Bitcoin recovered from a sharp decline to $77,603 and moved back above $79,000 on Sept. 9, putting the market's largest cryptocurrency close to its recent session high of $79,742.
The rebound followed a heavy sell-off on Sept. 8, when Bitcoin briefly fell toward the $77,600 area. Buyers responded quickly, pushing BTC higher during the overnight and morning session. The recovery returned the price toward $79,200–$79,320 after an earlier move to $79,742.
Despite the rebound, Bitcoin has not yet confirmed a broader breakout. The $79,742 level remains the immediate resistance point, followed by the psychologically important $80,000 threshold. On the downside, $77,603 remains an important reference level because it marks the low from which the latest recovery developed.
Bitcoin's market data and price history can provide a broader reference for BTC/USD movements, although Bitcoin trades across many independent markets and individual exchange prices can differ.
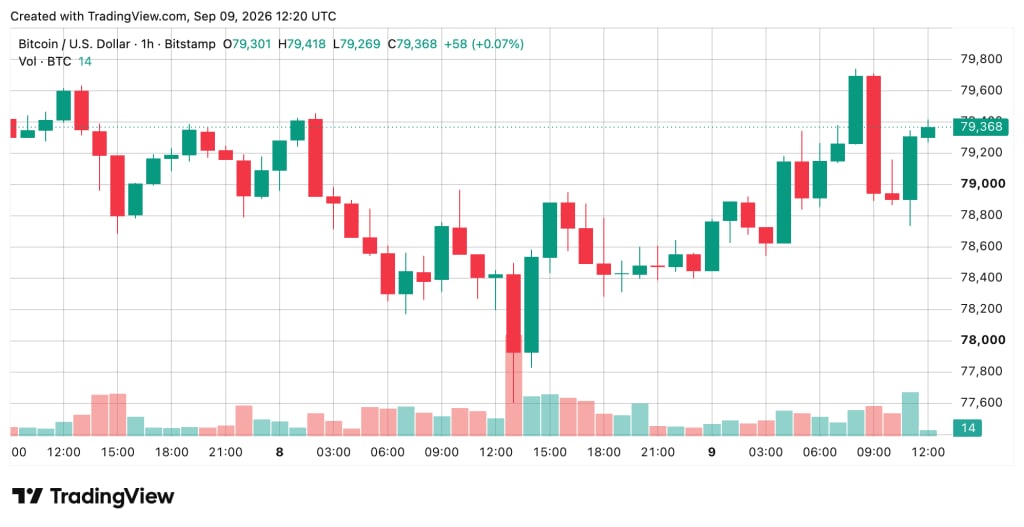
Buyers defend the $77,603 low
Bitcoin's one-hour price structure shows a sharp shift from selling pressure to buying activity. Before the decline, BTC moved sideways, but a strong downward move eventually pushed the price to $77,603. The drop coincided with the largest visible volume bar since Sept. 7 in the supplied chart analysis.
Buyers then stepped into the weakness and drove Bitcoin toward $79,742. After that advance, the price pulled back toward approximately $78,800–$79,000 before recovering again into the $79,200–$79,320 region.
This leaves several short-term levels in focus. Support is concentrated around $79,000 and $78,800, while resistance begins near $79,500 and becomes more significant around $79,742. A renewed move toward $77,603 would challenge the recovery structure that developed after the sell-off.
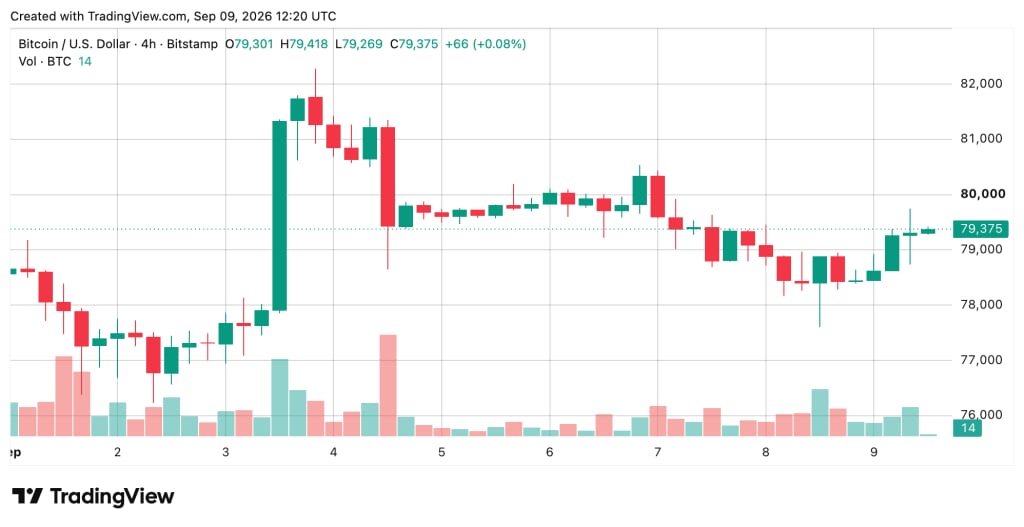
Four-hour chart puts $80,000 in focus
The four-hour view provides a broader picture of the rebound. Bitcoin had previously traded around the $78,500–$79,500 area before the sharp decline toward $77,603. The subsequent recovery produced a strong move back toward $79,742.
However, the latest advance stalled below the $79,700–$80,000 region. That makes the area particularly important for determining whether the recovery can develop into a stronger upside move or remains a rebound within the existing range.
A four-hour close above $79,742 would represent a stronger sign that buyers are extending the recovery. Conversely, losing $79,000 could put the recent bounce under pressure and increase the possibility of another test toward the $77,600 area.
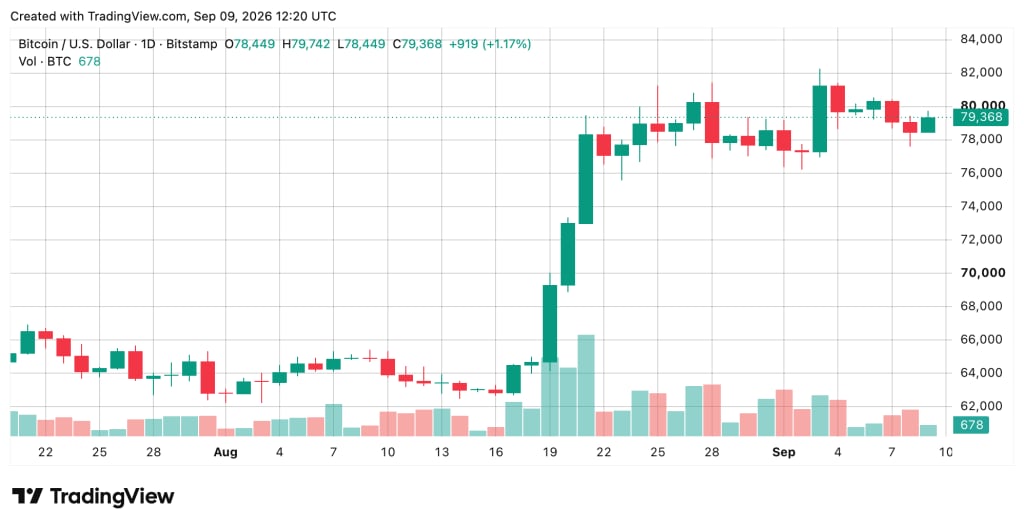
Bitcoin remains inside its broader weekly range
The recovery has improved Bitcoin's short-term structure, but the broader range remains intact.
Bitcoin reached approximately $82,200–$82,300 on Sept. 3 before moving lower. Lower highs followed through Sept. 4–7, while the Sept. 8 decline pushed BTC toward approximately $77,620–$77,666. The following recovery brought the cryptocurrency back above $78,400 and then toward the $79,000–$79,300 area.
Based on the supplied market snapshot, BTC was around $79,107 at 8 a.m. EDT, up approximately 0.9% over 24 hours, with a market capitalization of about $1.588 trillion. The reported intraday range was approximately $77,666–$79,701.
Bitcoin's broader market structure can also be understood through Bitcoin's technical and educational resources, which explain the underlying asset and network rather than providing a trading forecast.
Technical indicators show mixed momentum
Bitcoin's daily oscillators presented a mixed picture in the supplied analysis. The readings included eight neutral signals, two bullish readings and one bearish signal.
The RSI stood at 63, while Stochastic was 46, CCI was 45 and ADX was 47. These indicators were classified as neutral. The Awesome Oscillator also remained neutral at 6,522.
Momentum and Bull Bear Power were more constructive. Momentum registered 1,747, while Bull Bear Power came in at 1,207, with both receiving bullish readings. Meanwhile, the MACD level was 2,708 but carried a bearish rating in the supplied technical gauge.
Other readings were also largely neutral. Stochastic RSI Fast stood at 4, Williams Percent Range at -47 and the Ultimate Oscillator at 59.
The combination suggests that Bitcoin's recovery had not pushed all short-term momentum indicators into an overheated condition, but the signals were not uniformly bullish either.
Moving averages remain supportive
Moving averages provided the strongest bullish component of the daily technical analysis.
The supplied gauge recorded 14 bullish moving-average readings, one neutral reading and zero bearish readings. The 10-, 20-, 30-, 50-, 100- and 200-period exponential moving averages stood at approximately $78,931, $77,138, $75,215, $72,563, $70,564 and $72,830, respectively.
The corresponding simple moving averages were approximately $79,136, $78,753, $74,191, $70,215, $66,654 and $69,927, with each receiving a bullish classification.
The VWMA was approximately $78,687, while the Hull Moving Average stood around $79,135, both carrying bullish readings. The Ichimoku Base Line was neutral at approximately $72,467.
For beginners, moving averages are commonly used to smooth price data and identify the direction of a trend. They do not guarantee future price movements, but they can help traders understand how the current price compares with historical averages.
Bitcoin's educational resources also emphasize that its market price can change substantially over short periods, reflecting the asset's inherent volatility.
What Bitcoin needs to clear next
The immediate battle is centered around the $79,742 resistance level. Bitcoin's ability to move above that point would strengthen the recovery from $77,603 and bring the $80,000 psychological level into clearer focus.
Above $80,000, the supplied technical analysis identifies another resistance zone around $80,500–$80,600, followed by the earlier $82,200–$82,300 area.
On the downside, Bitcoin needs to maintain the $79,000 region to preserve the immediate recovery structure. A move below that level would bring $78,800 back into focus, while a deeper decline could retest the $77,603–$77,666 area.
The Bitcoin market data page also notes that there is no single official Bitcoin price because BTC trades across multiple independent markets, meaning prices can vary slightly between exchanges.
Bitcoin bulls regain short-term momentum
Bitcoin's rebound from $77,603 has put buyers back in control of the immediate price action, but the recovery still faces an important test.
The move toward $79,742 shows that buyers were willing to defend the recent low, while the daily moving-average readings remain broadly supportive. At the same time, mixed oscillator signals and resistance below $80,000 mean the recovery has not yet established a confirmed breakout.
For now, $79,742 is the key upside level and $77,603 remains the critical downside reference. A sustained move through the former would strengthen the recovery narrative, while a break below the latter would weaken the short-term structure that emerged after Tuesday's sell-off.
As Bitcoin trades near the upper end of its recent rebound, the next decisive move will likely depend on whether buyers can convert the recovery into a sustained break above resistance rather than another rejection inside the existing range.