Bitcoin Price Recovery Runs Into Resistance
Bitcoin traded at $83,200 at 8:30 a.m. Eastern time on Tuesday, October 13, 2026, as buyers attempted to extend a recovery from recent lows near $80,000. The rebound has brought the price back toward the $84,000 area, but repeated resistance has prevented a clear move higher.
The supplied market data shows 24-hour trading volume of $32.77 billion, with bitcoin moving between $81,018 and $84,074 during the period. Although several technical indicators suggest the recovery retains some support, the price action indicates that buyers have yet to establish sustained momentum above the immediate resistance zone.
The main levels to watch are resistance between $83,800 and $84,254 and support near $82,500. A breakout above resistance could strengthen the recovery, while a sustained move below support would put lower price levels back in focus.
Short-Term Chart Shows a Struggle Near $84,000
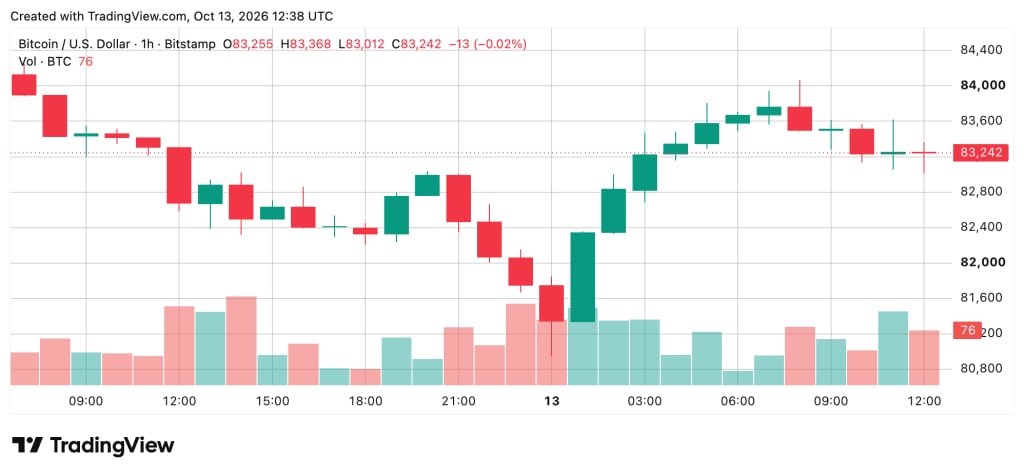
Bitcoin’s one-hour chart shows a rebound from approximately $80,948 followed by attempts to move back above $83,800. Those attempts have met selling pressure, and the formation of lower highs suggests that short-term buying momentum has weakened.
Initial support sits around $82,800 to $83,000, with another potential support area near $82,400. If bitcoin moves back above $83,500 and holds that level, it could make another attempt at the $84,000 region. A break below $82,800, however, would weaken the short-term recovery and bring $82,000 into view.
These levels are technical reference points rather than guarantees of where the price will move next. Market conditions and trading volume will help determine whether either side can establish a more durable direction.
Four-Hour Chart Puts $82,500 in Focus
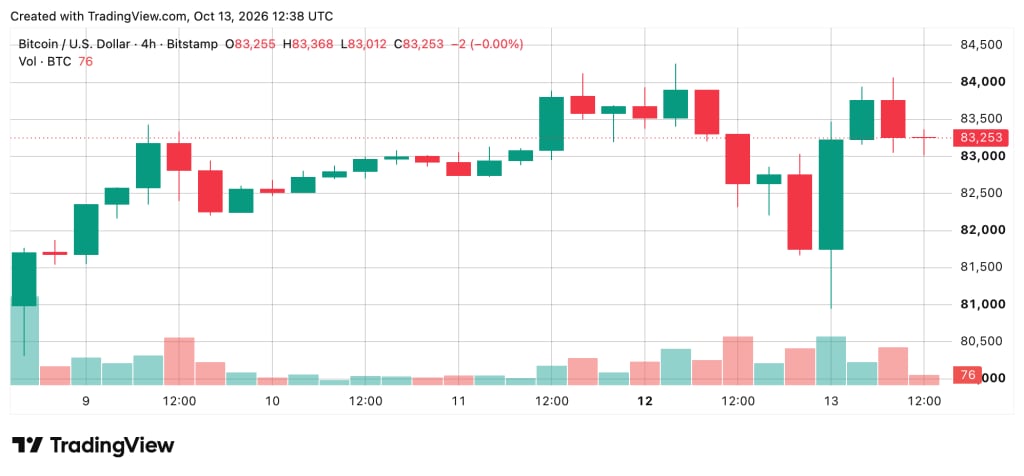
The four-hour chart shows bitcoin recovering from around $80,308 before running into resistance between $83,800 and $84,254. Attempts to establish a stronger position above $83,500 have so far produced limited follow-through, suggesting that the market is still struggling to sustain higher prices.
Holding above $82,500 would preserve the current recovery structure in the near term. If that level fails, the next areas to monitor are approximately $81,700 and $80,300. These levels could become relevant if selling pressure increases.
On the upside, a convincing four-hour close above $84,254 would provide stronger evidence that buyers are overcoming the current resistance zone. The next potential milestone would be $85,000, although further gains would depend on whether buying demand continues after a breakout.
Daily Chart Shows the Broader Recovery Is Still Being Tested
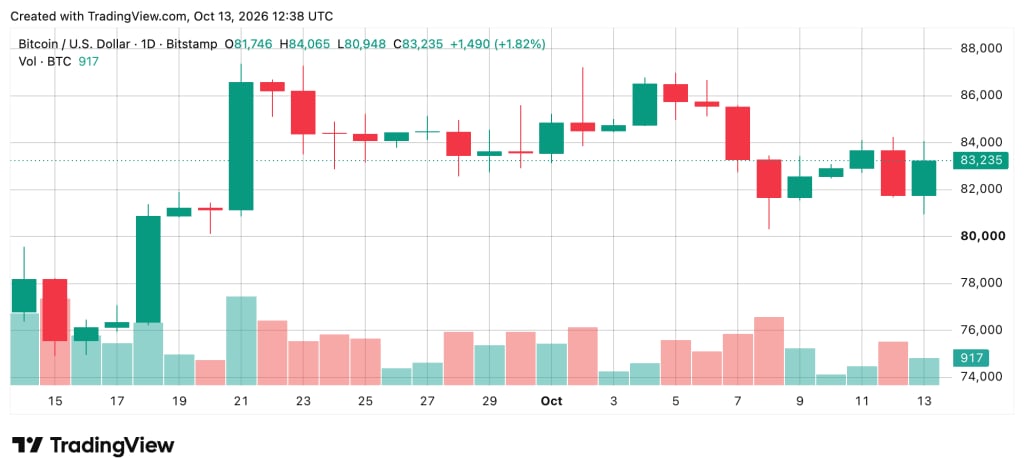
The daily chart provides a wider view of bitcoin’s recent price movement. The cryptocurrency previously advanced from approximately $74,913 to $87,374 before entering a period of consolidation and forming lower highs.
Buyers have continued defending the $81,000 to $82,000 region, preventing the latest pullback from turning into a more decisive breakdown. Tuesday’s positive candle offers some encouragement, but bitcoin remains below the $84,000 to $85,000 resistance area.
A daily close above $85,000 would strengthen the argument that the recovery is regaining momentum. Conversely, sustained weakness below $81,000 would put the $80,308 region under renewed pressure and challenge the broader recovery structure.
Oscillators Point to an Uncertain Market
Bitcoin’s momentum indicators present a mixed picture rather than a clear directional signal. The relative strength index (RSI) stands at 52.30, indicating broadly balanced momentum. The Stochastic oscillator is at 37.39, while the commodity channel index (CCI) reads -94.04.
The average directional index (ADX) is 29.47 with a bearish classification, and the moving average convergence divergence (MACD) indicator stands at 638.14, also carrying a bearish signal in the supplied data. By contrast, the Awesome Oscillator remains positive at 668.36, while the momentum indicator reads -1,516.41 despite being classified as bullish.
Overall, seven oscillators are neutral, two are bullish and two are bearish. This combination suggests that the indicators do not yet establish a strong consensus on bitcoin’s next move. Traders can learn more about these tools in this guide to oscillators in bitcoin trading.
Moving Averages Retain a Bullish Bias
Moving averages provide a more constructive signal than the oscillators, although several shorter-term averages remain above the current price. Bitcoin is trading above its 20-period exponential moving average (EMA) at $83,125.18 and its 50-period simple moving average (SMA) at $81,107.45. The 100-period and 200-period averages also favor the bullish side in the supplied analysis.
However, the 10-period SMA at $83,693.18 and the 20-period SMA at $83,952.43 remain overhead resistance levels. Their proximity to the current price helps explain why bitcoin has struggled to move decisively beyond the $84,000 area.
Of the 15 moving-average indicators tracked in the analysis, 10 are bullish, four are bearish and one is neutral. This distribution supports the view that the recovery retains some underlying strength, but it does not guarantee that resistance will break. For background on how these indicators work, see this moving averages guide for bitcoin trading.
Key Bitcoin Price Levels to Watch
The immediate outlook depends on whether bitcoin can break through resistance or loses the support levels holding up the recovery.
Resistance at $83,800–$84,254: A sustained move above this zone would indicate that buyers are making progress against recent selling pressure.
Upside levels at $85,000 and $85,500: These are potential areas to monitor if a breakout gains traction.
Support near $82,500: Holding above this level would help preserve the near-term recovery structure.
Lower support at $81,700 and $81,000: These levels could become important if bitcoin falls below $82,500.
Major reference level near $80,308: A decline below this area would put the recent recovery under greater pressure.
These levels reflect the technical setup described in the supplied market data, not certain price targets. Bitcoin can move through support or resistance quickly, particularly when market conditions change.
What Comes Next for Bitcoin?
Bitcoin’s recovery remains caught between supportive moving averages and weaker short-term momentum. The price has rebounded from the $80,000 area, but repeated resistance near $84,000 has prevented buyers from establishing a convincing breakout.
A sustained move above $84,254, supported by stronger trading volume, would improve the technical picture and bring $85,000 into focus. If bitcoin instead breaks below $82,500, traders may watch the $81,700 and $81,000 areas for signs of further weakness.
For now, neither direction has been confirmed. The next move will depend on how bitcoin responds to these key levels and whether momentum indicators begin to align with the price action.